

Open the Routing dashboard
1
Log in to Cal ID
Access your main account dashboard.
2
Navigate to Insights
Click Insights in the left-hand sidebar menu.
3
Select the Routing tab
Click the Routing tab at the top left of the insights page to view analytics specific to your forms.
Key routing metrics & definitions
Routing form summary
This scorecard provides a high-level view of form performance within your selected date range.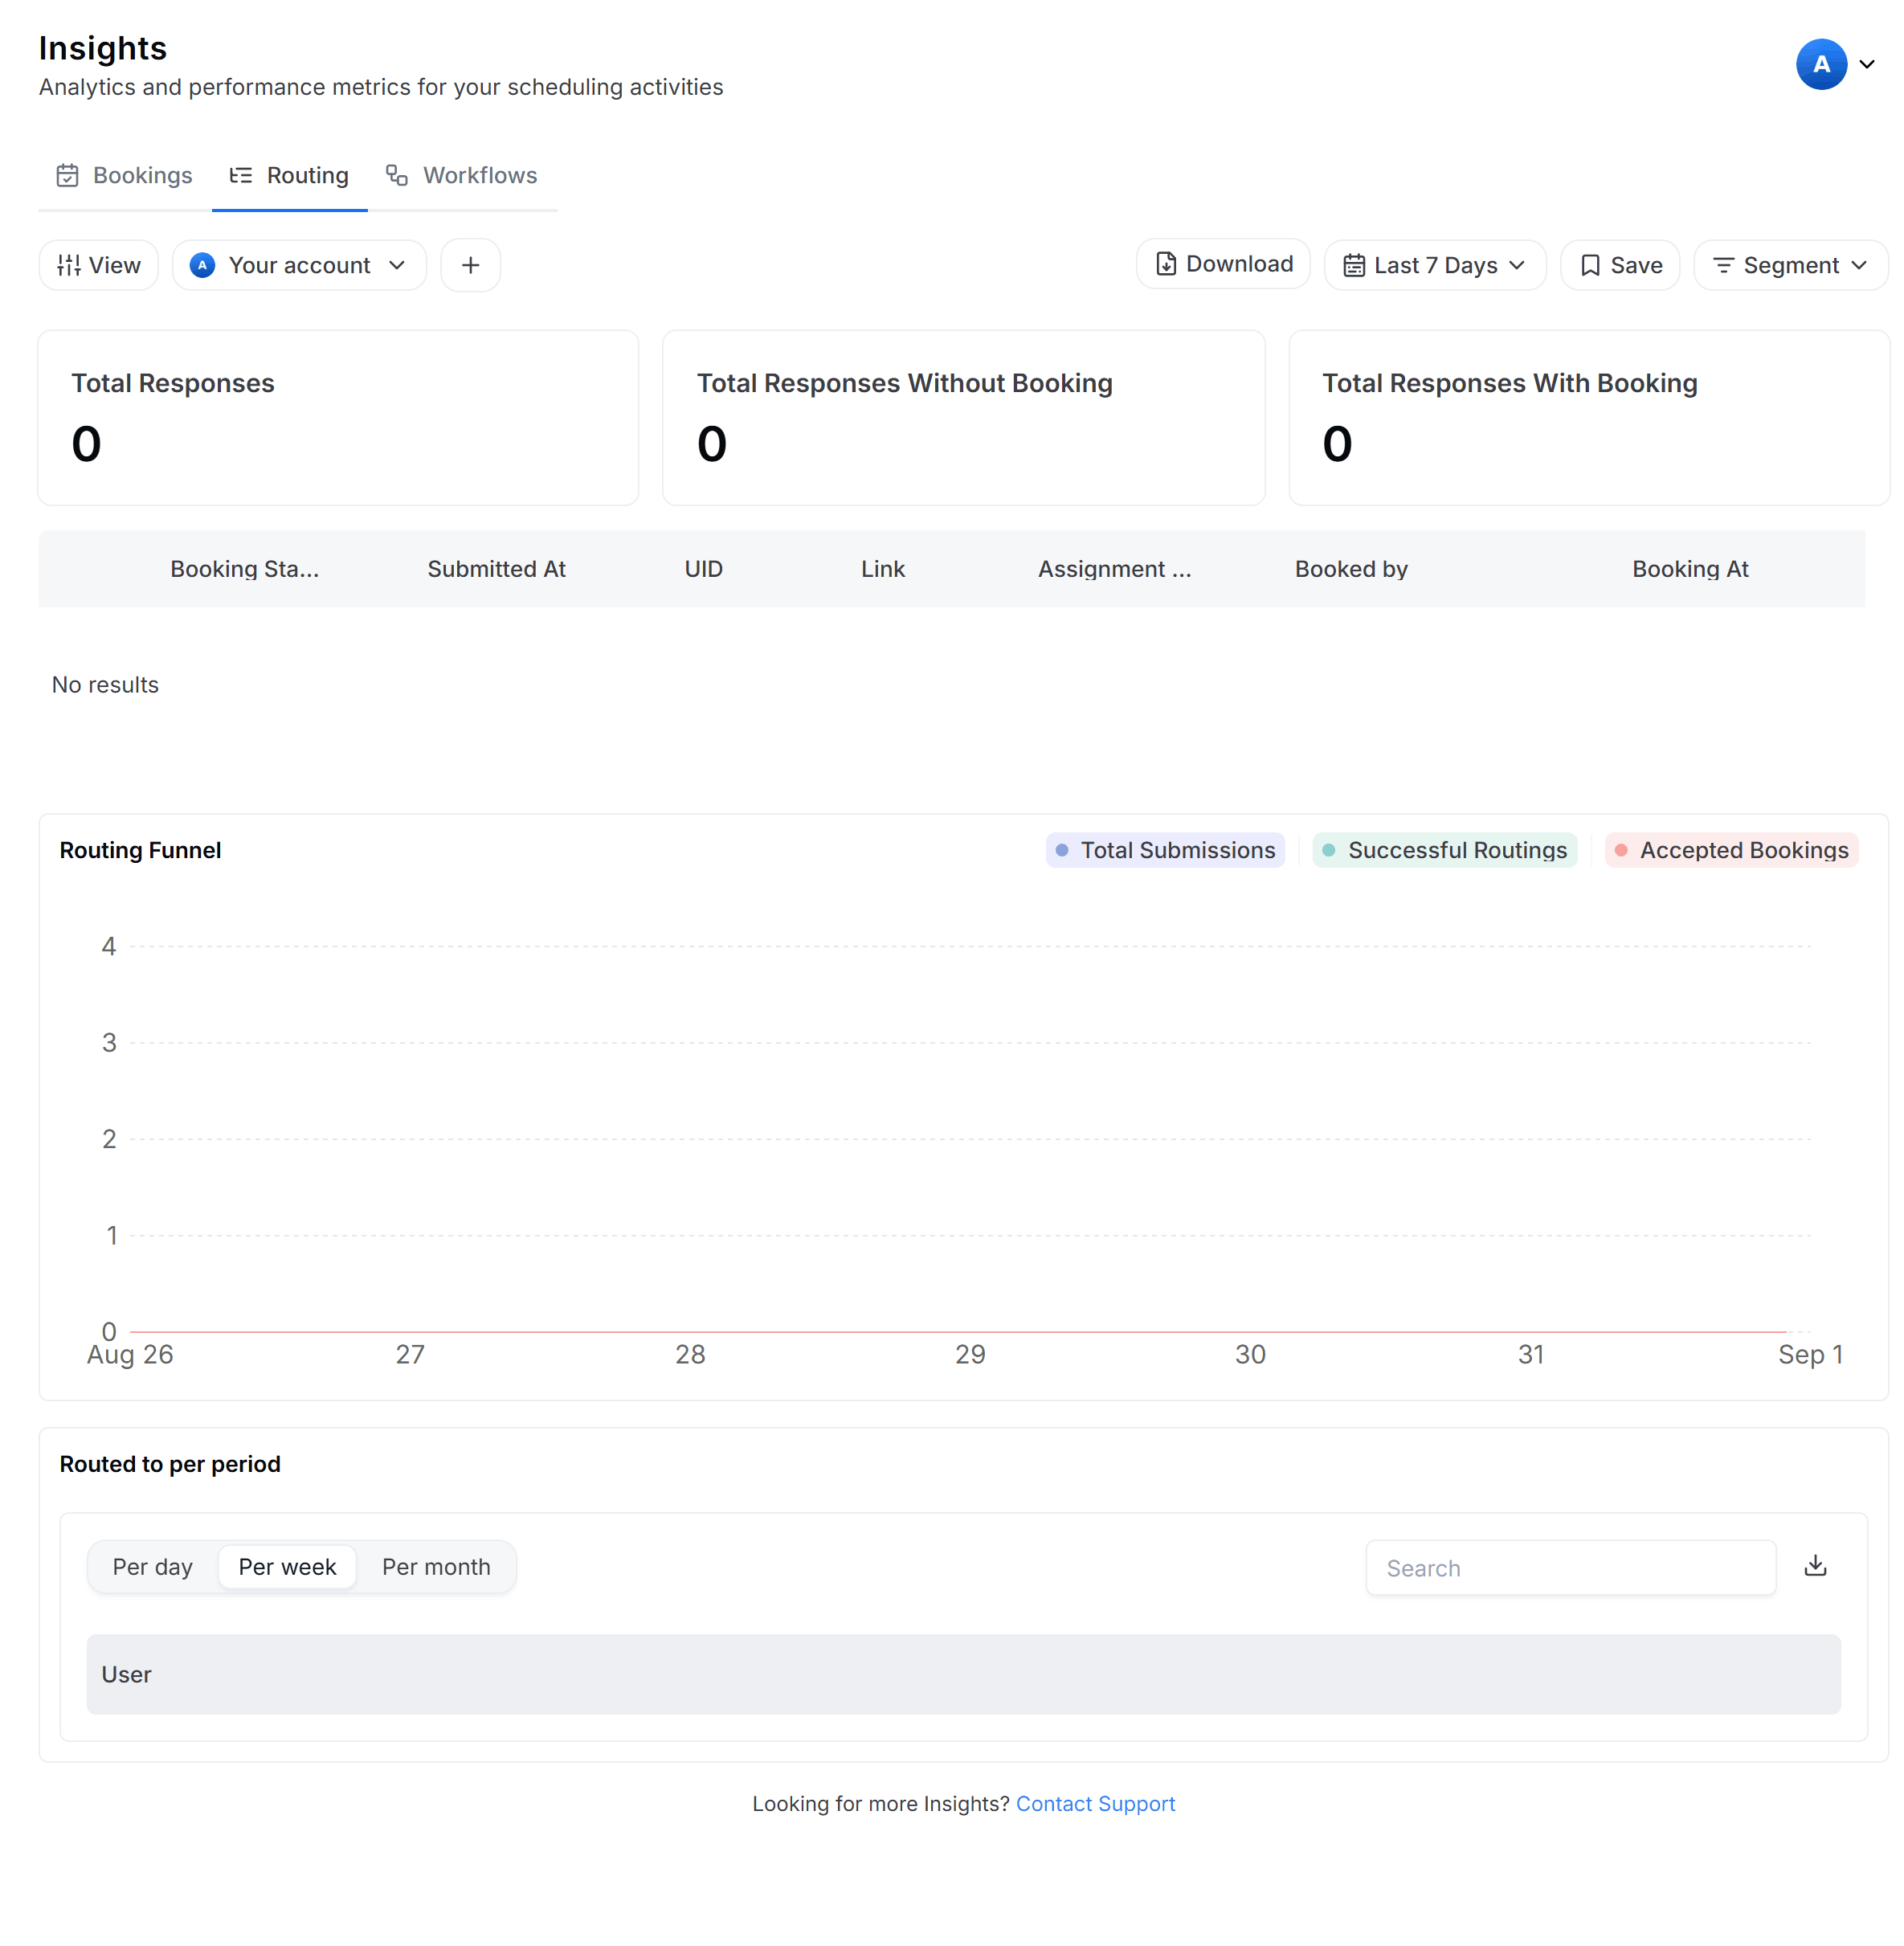
Sizing up how the form converts
Routing funnel analysis
Shows date-wise trends for Total submissions, Successful Routings, and Accepted Bookings.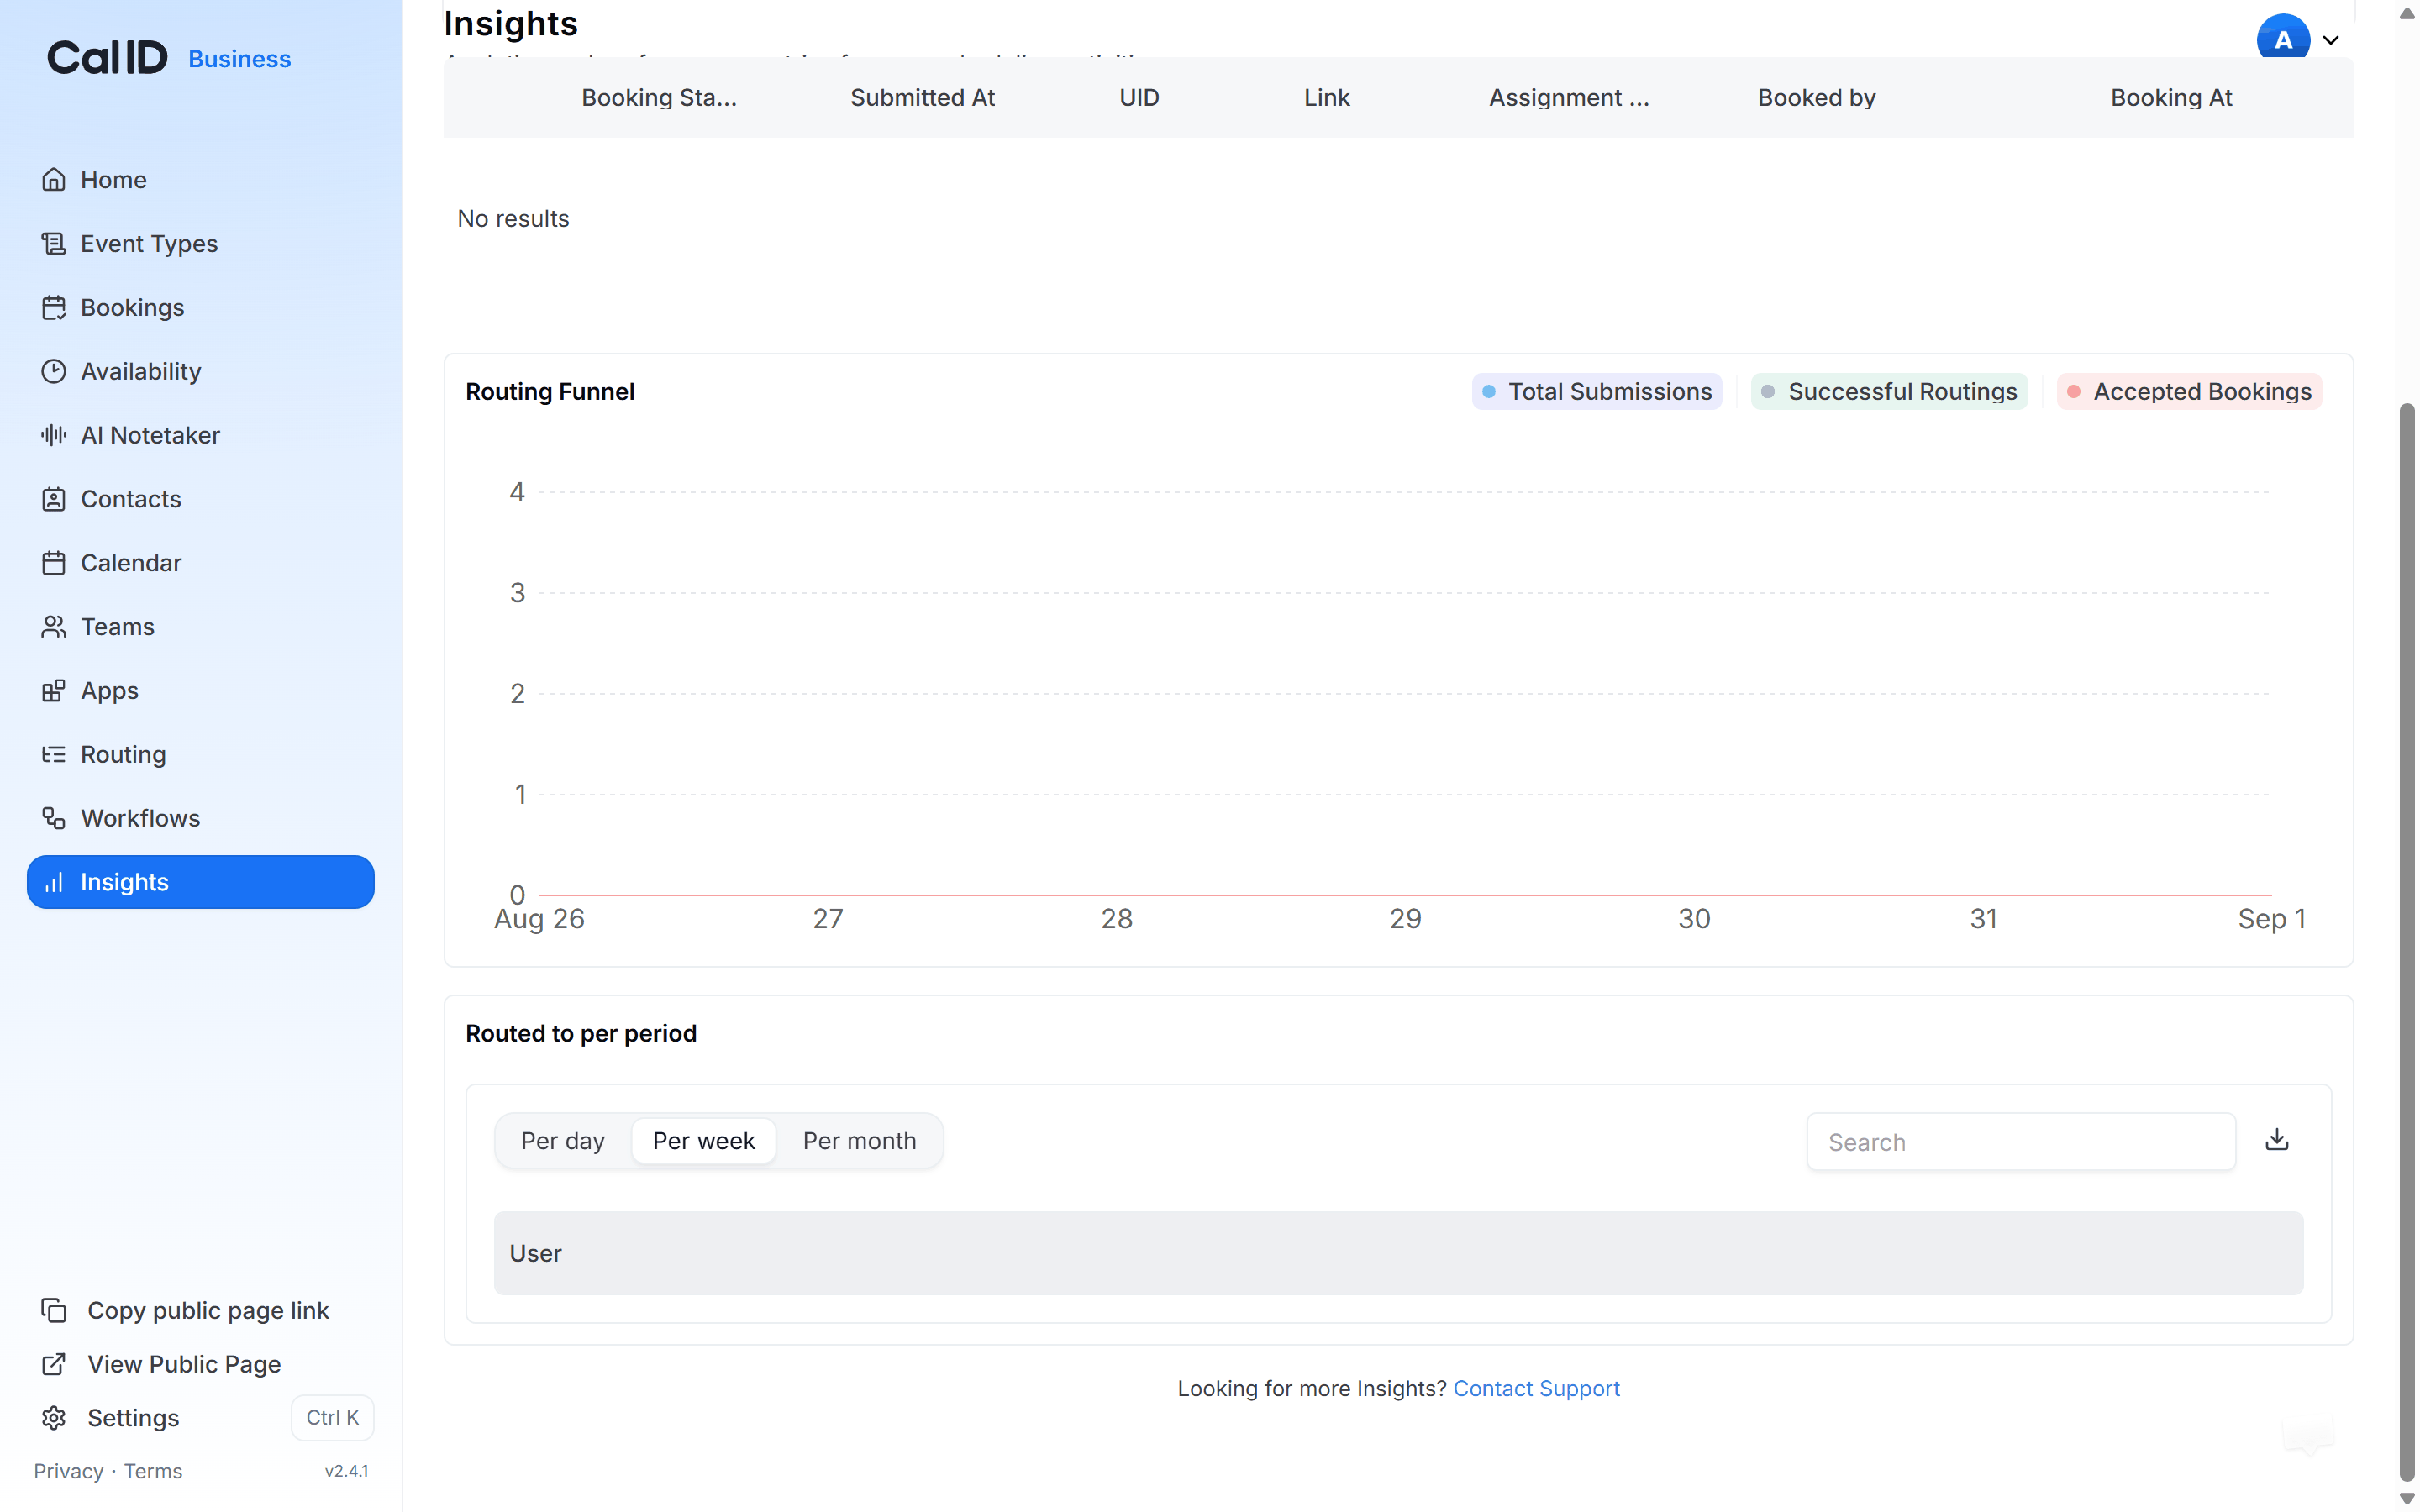
Tracking submissions through to bookings
Performance graphs & data trends
- Submission Timeline: A graph showing daily or weekly form submissions, allowing you to correlate form activity with marketing campaigns.
- Drop-off Visualization: A visual representation of where visitors stop completing the form, helping you identify confusing questions.
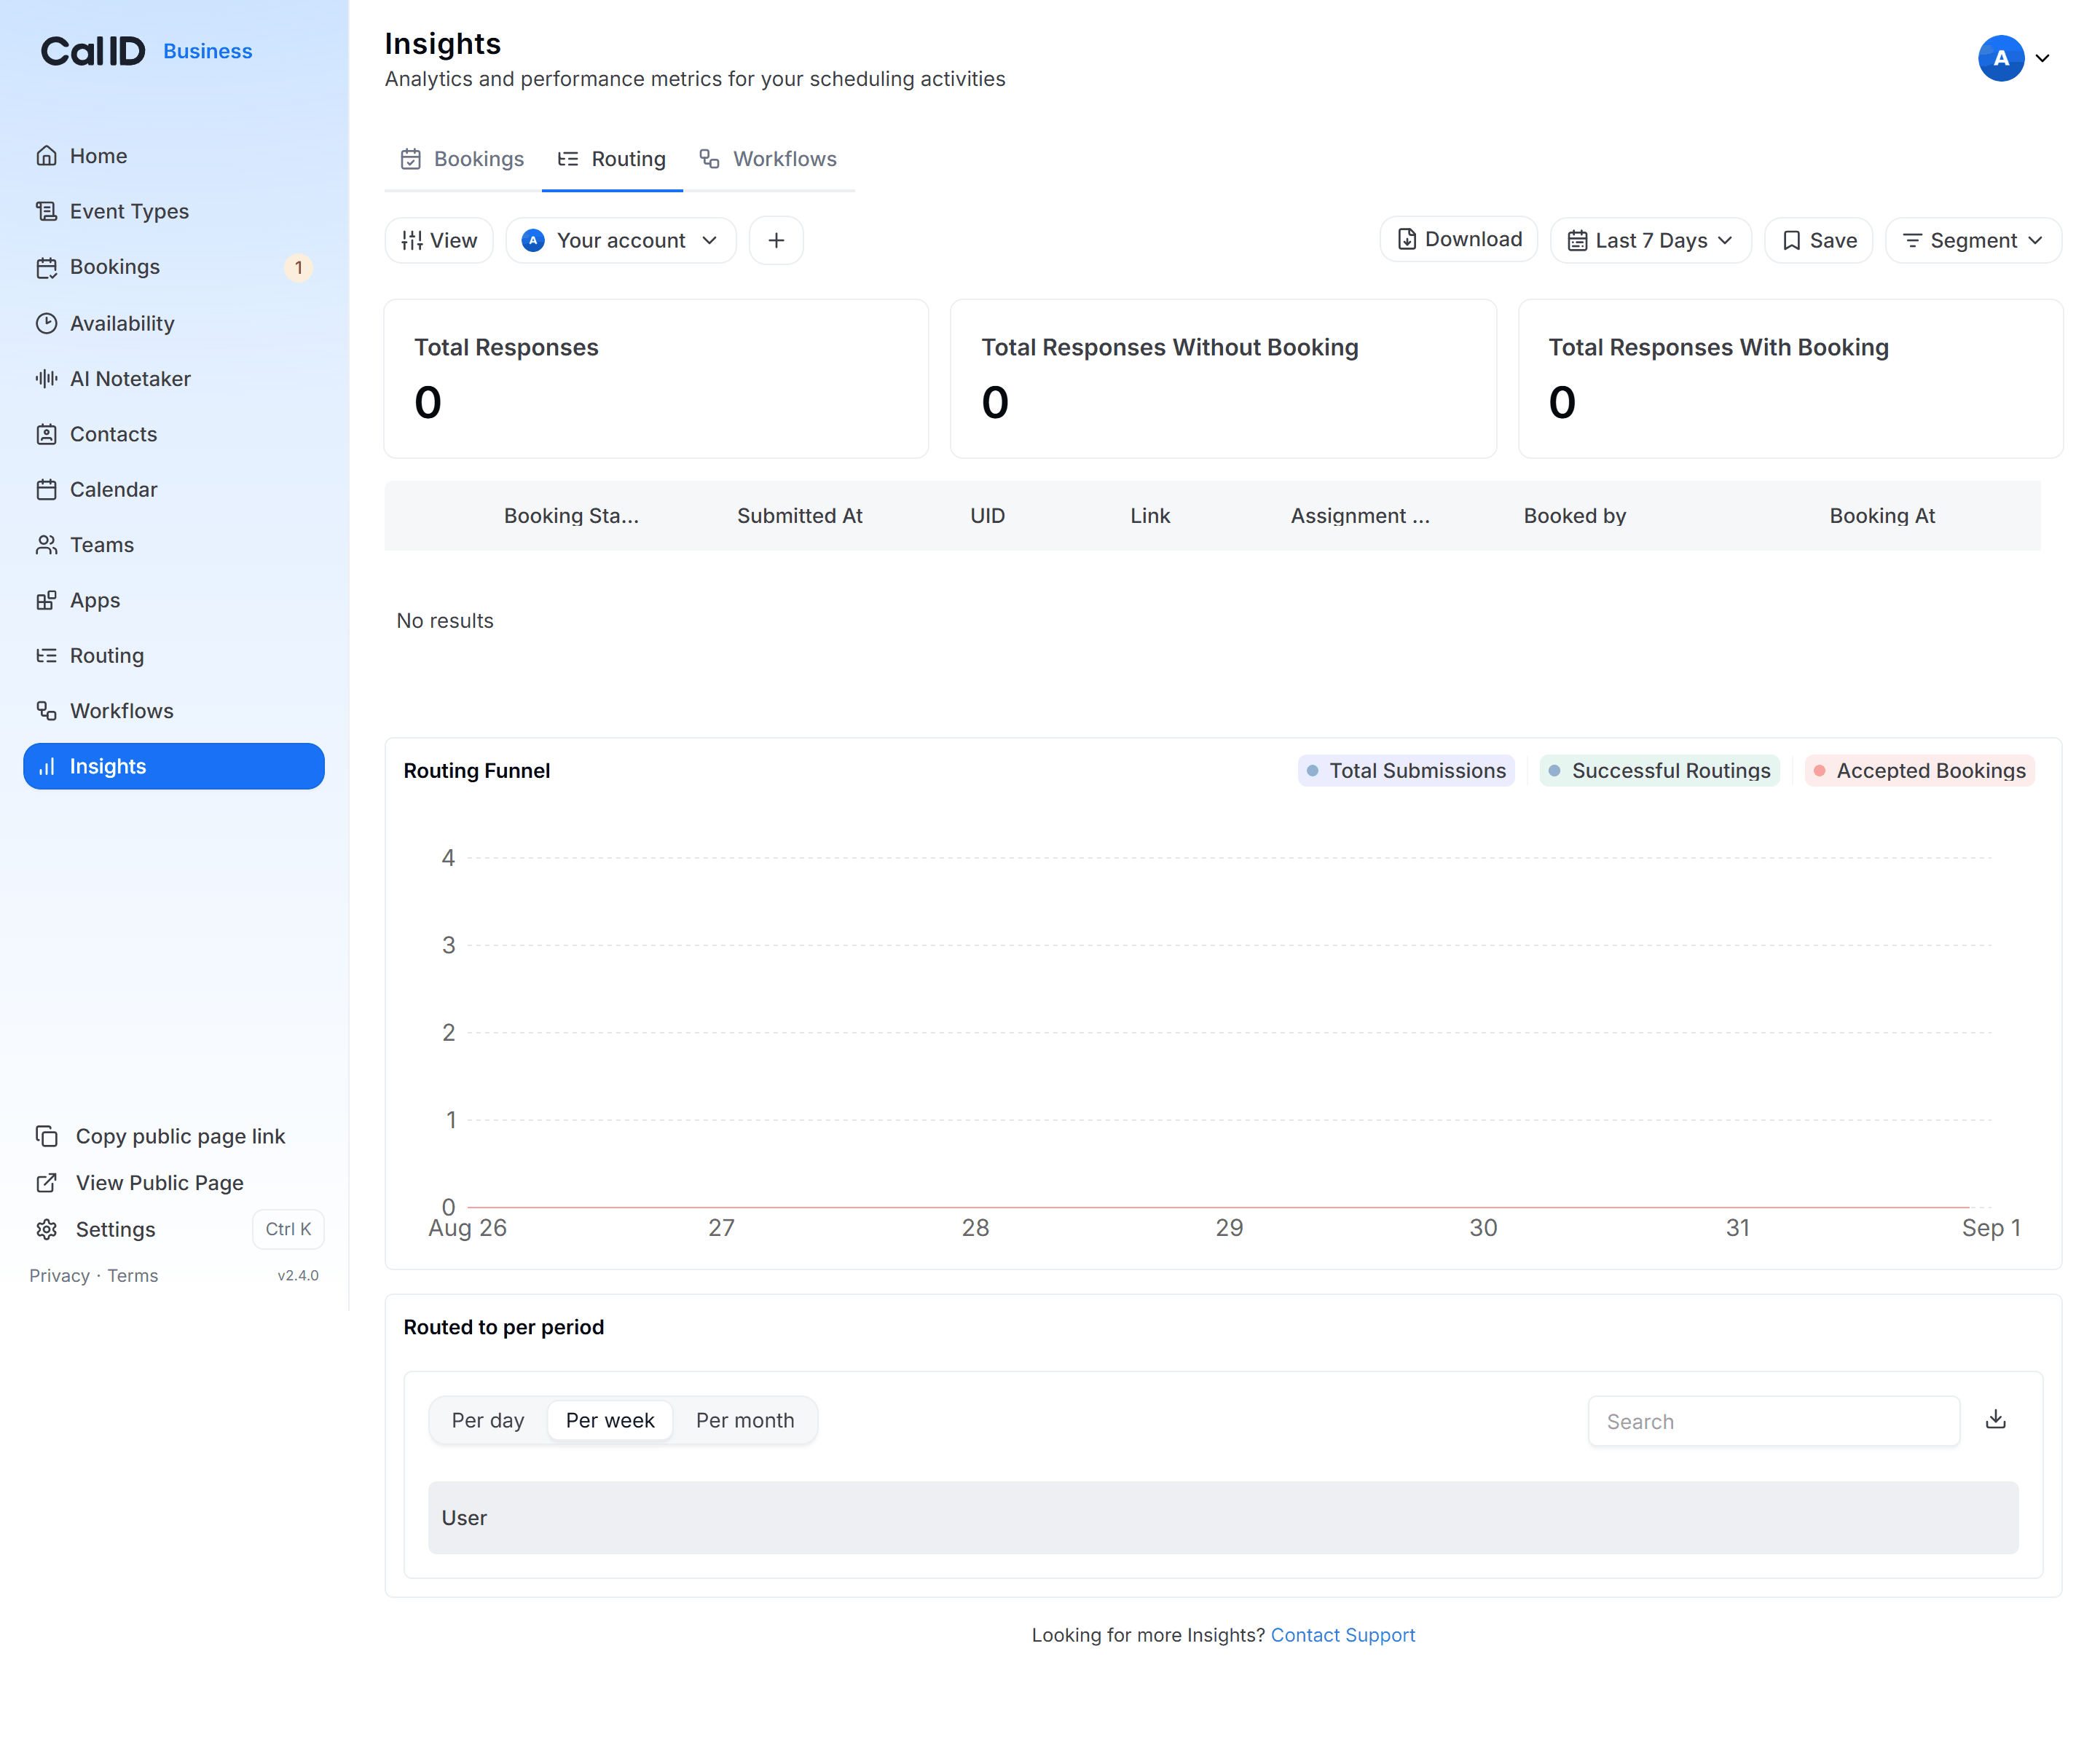
Seeing where people abandon the form
Filtering and customizing data
Filters apply to every scorecard and graph on the page. Set your date range, form, and account before reading the numbers so you’re comparing the right data.
- Date Range Selector: Use the dropdown in the top right to analyze data from specific periods, such as Last 30 Days or Custom Range.
- Form Selector: If you have multiple routing forms, use the dropdown to view insights for a Specific Form or All Forms.
- Account Filter: Switch between Personal routing data or specific Team routing data using the filter in the top left.
- Export Data: Click Download in the top right to export your routing data as a CSV or PDF for advanced analysis.
Related routing and analytics
Build a routing form
Create and configure the qualifying questions that feed these insights.
Booking performance
Track booking efficiency, meeting trends, and no-show rates across your events.