

Open the Workflows dashboard
1
Log in to Cal ID
Access your dashboard at Cal ID.
2
Open Insights
Click Insights in the left-hand sidebar.
3
Select the Workflows tab
Click the Workflows tab at the top of the dashboard.
Key metrics and reports
Execution scorecards
These scorecards summarize how your automations performed across the selected date range.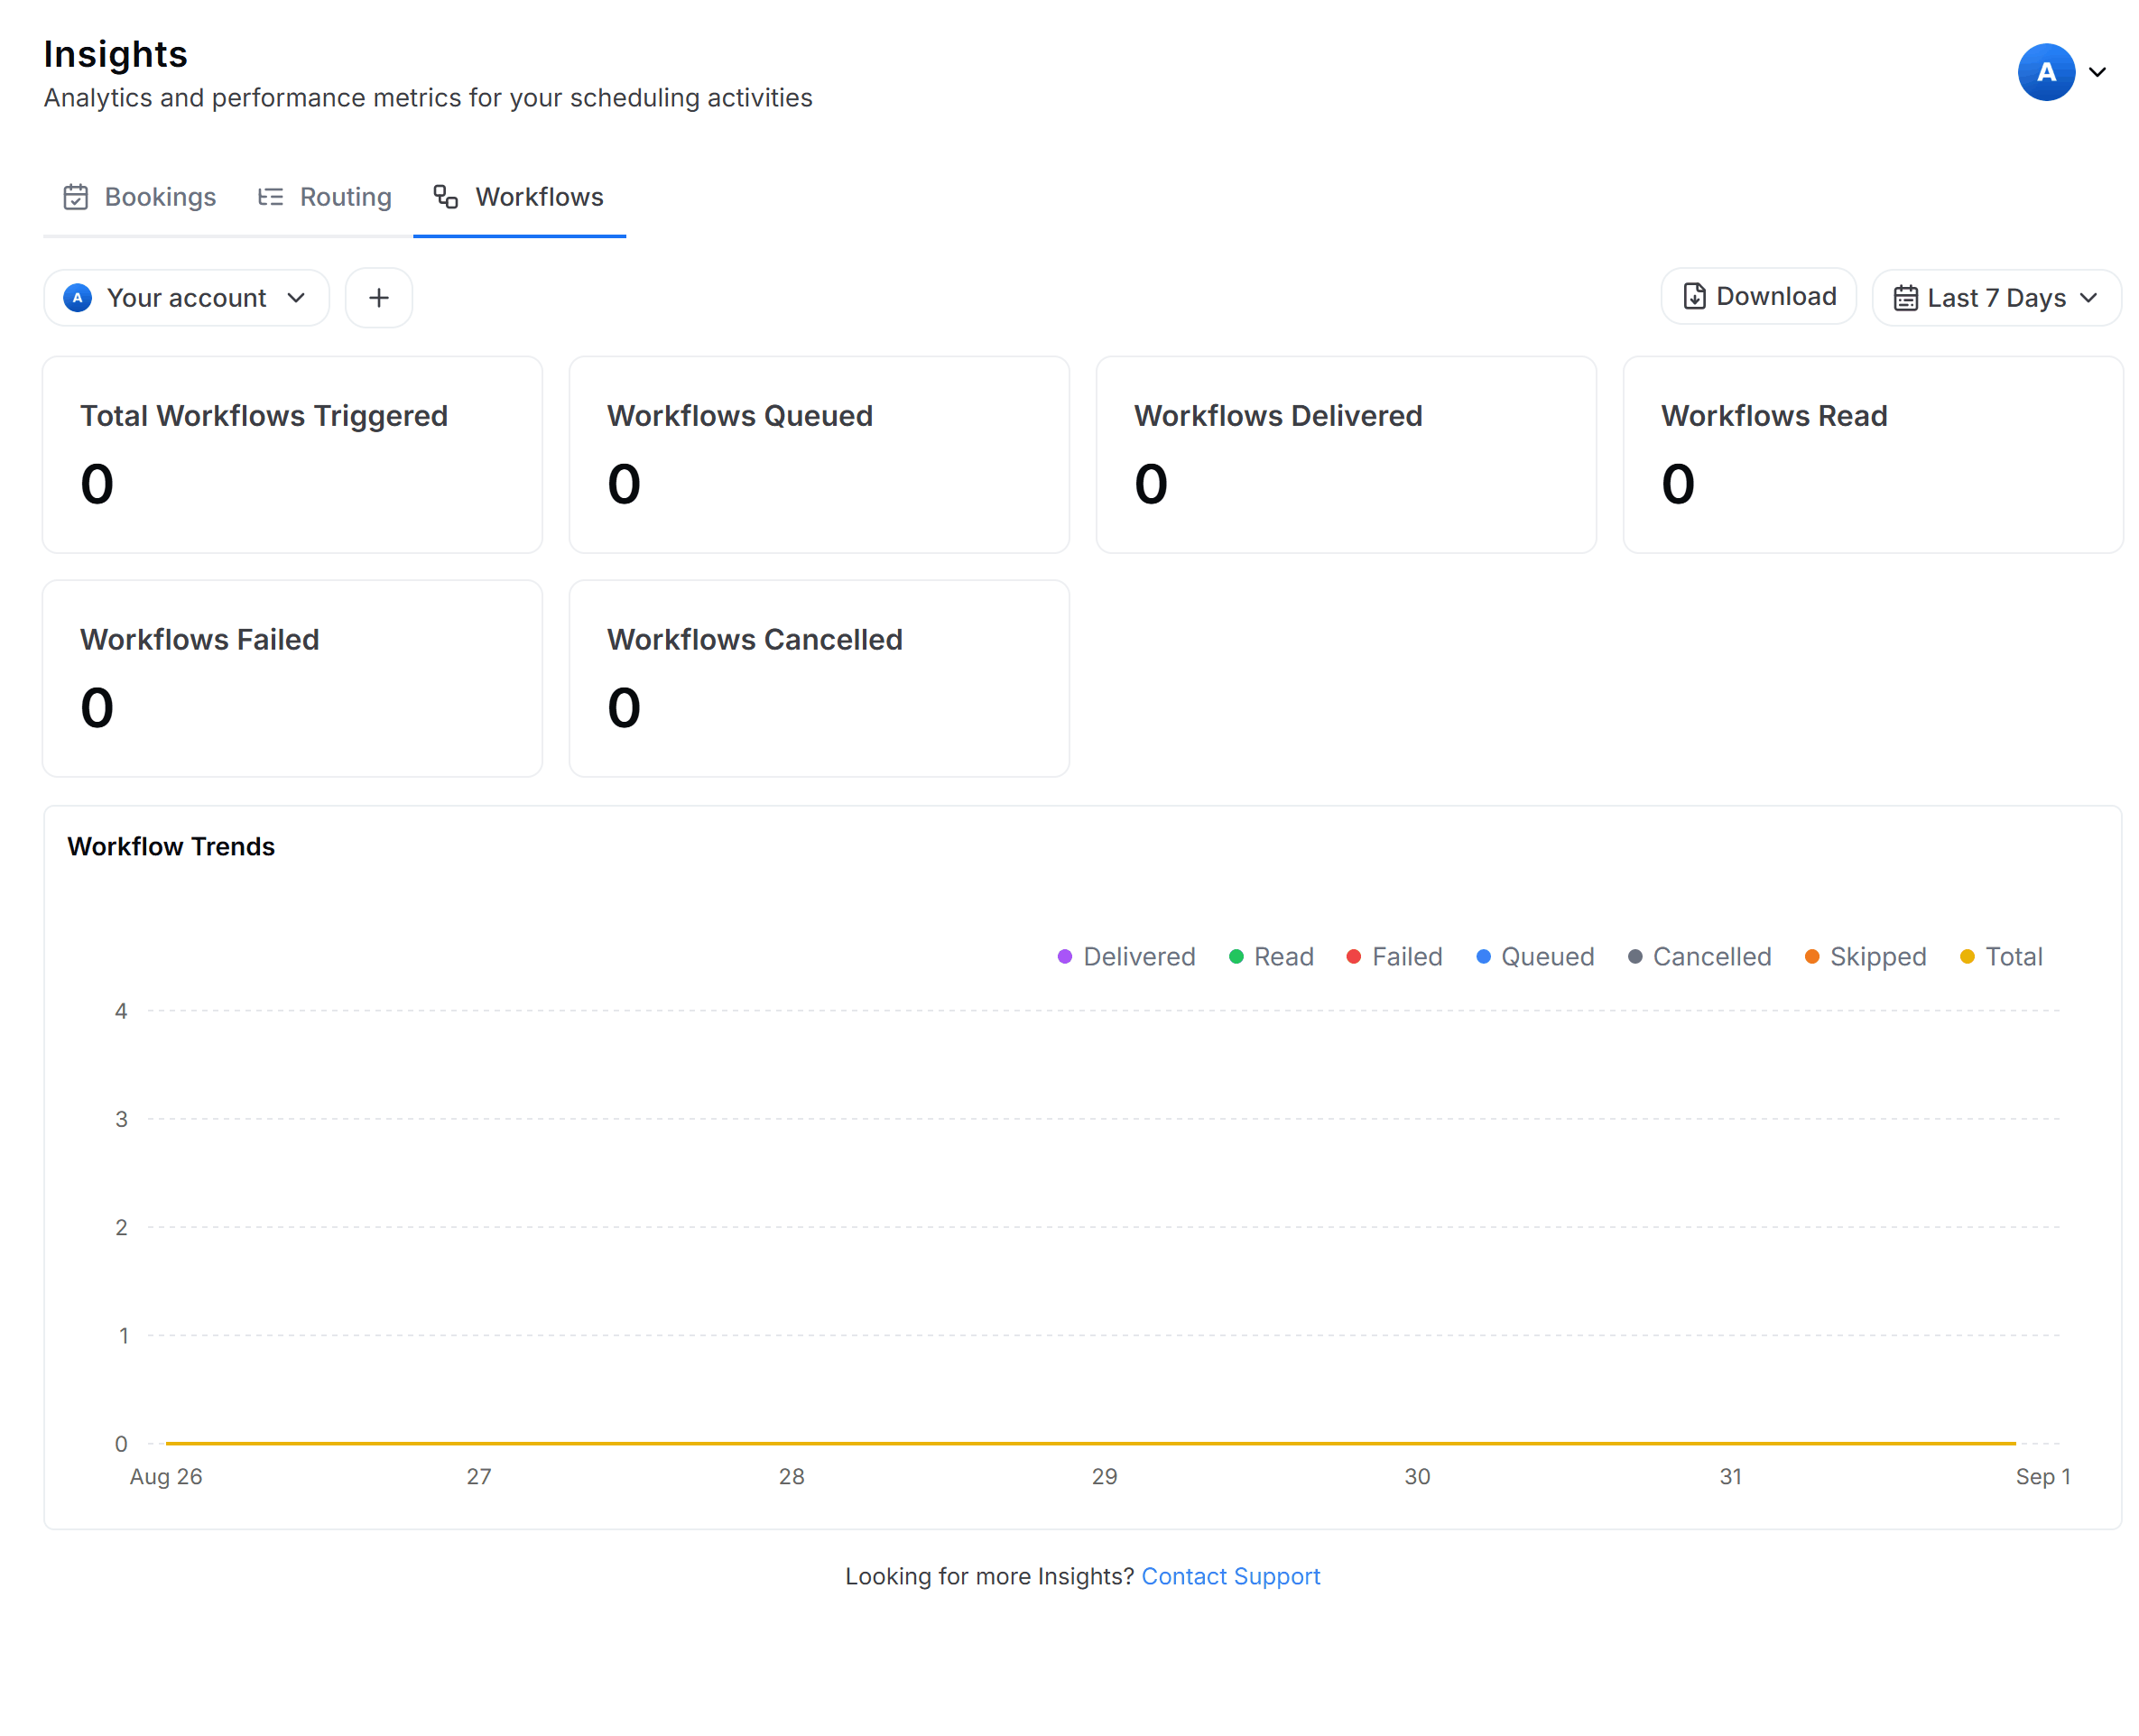
Checking your automations are healthy
Date-wise analysis
- Delivery Status Trends: A graph showing the volume of automated tasks handled by Cal ID over the selected date range and their status.
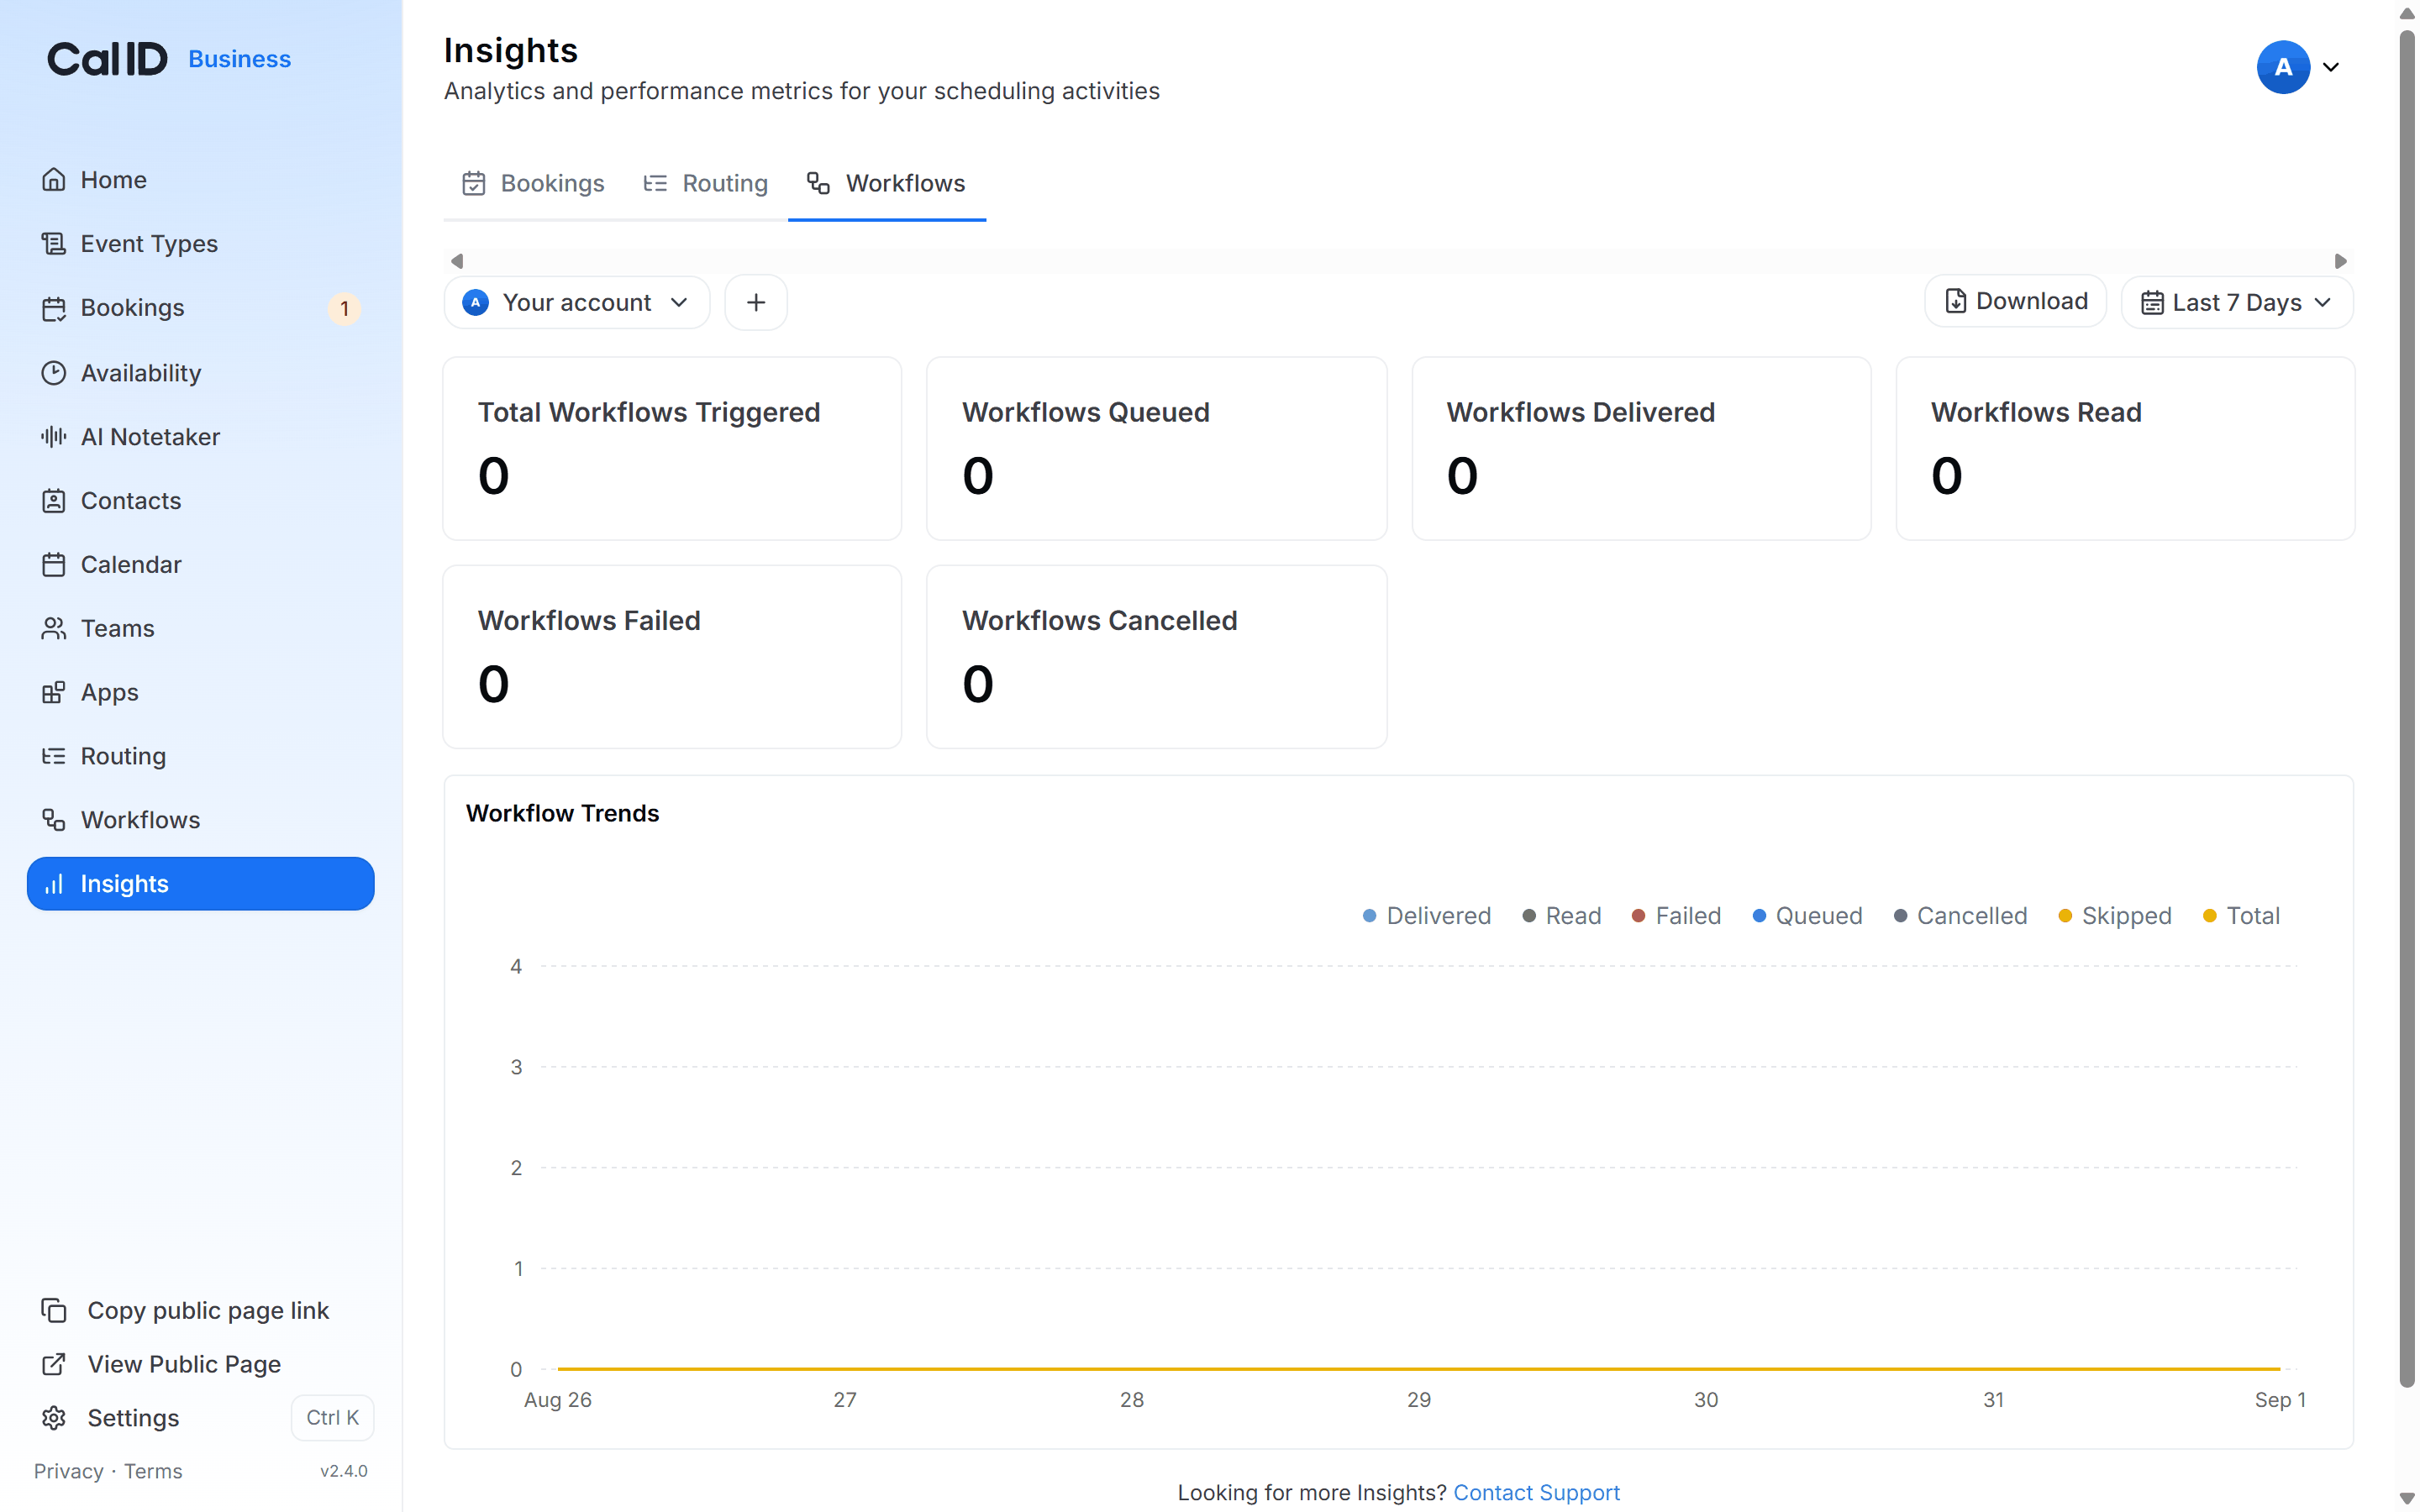
Catching failures before they cost bookings
Filtering and account selection
Both filters apply to every scorecard and graph on the page. Set them before reading the numbers so you’re comparing the right period and account.
- Date Range: Use the top-right filter to see how many automations ran during a specific campaign or month.
- Team vs. Personal: Switch the account filter at the top left to see if team-wide workflows are performing differently than your personal ones.
More Insights reports
Booking performance
Track booking efficiency, meeting trends, and no-show rates across your events.
Routing performance
See how visitors move through your routing forms and where they drop off.